HWC facility performance dashboard
Objective: To develop a dashboard of primary care facility (a.k.a. Health and Wellness Centers or HWCs) performance for the district using data from routine health management information systems.
Background: There are multiple routine data systems that are used to gather and monitor primary health care related data at the facility, district and state levels in India. However, these systems were designed to monitor implementation of vertical programs and are not integrated with each other. Additionally, neither of these systems individually provide a complete picture of the performance of every HWC facility in the district. To enable HWC facility and district managers to make informed decisions about strengthening PHC, IPSI plans to develop a dashboard that depicts HWC performance by aggregating data from multiple existing routine HMIS. The indicators comprising the dashboard will be a mix of facility-level and catchment community-level service coverage indicators, data for which will be sourced from routine HMIS.
Such a dashboard will enable district, block, and facility managers to:
- Monitor HWC performance indicators from across portals at one place.
- Comparison of HWC facility/ block performance within districts and over time.
- Linkages between facility level and catchment community performance indicators.
- Identification of gaps in performance and areas for improvement.
Steps undertaken:
The dashboard development process included three steps:
(1) Review of global and national literature on facility performance measurement and Indian PHC policy documents. Routine data systems used by HWC facilities were reviewed to construct an inventory of existing data points and indicators.
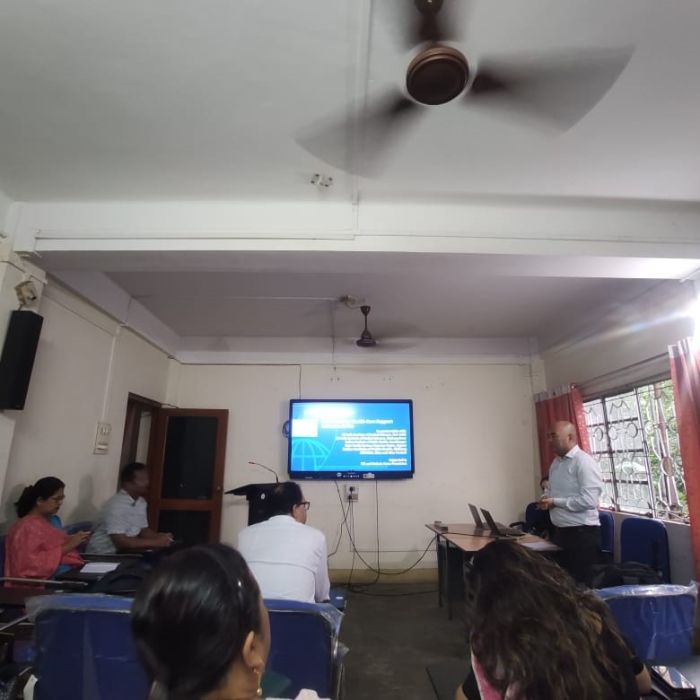
(2) Stakeholder consultations were held with PHC experts, in-state academic institutes and district health departments of the three districts to identify priority indicators for evaluating HWC performance.
(3) Data compilation, analysis and presentation; quarter-wise data were collected for select indicators, descriptive analysis was conducted, and visual representations of findings were presented to district authority officials. Iteratively, feedback from these consultations was incorporated into the dashboard.
HWC facility survey
Background:
The HWCs are routinely reporting data through various data management systems on various aspects of the program such as capacity/inputs, service delivery, service coverage. This data is being collected by the project teams for all HWCs in the three districts- Bhavnagar in Gujarat, Kalahandi in Odisha, and West Garo Hills in Meghalaya. The survey entails cross-checking the reported data with the actual status at the sampled facilities. This will help the district program managers to improve the quality of reported data and plan for improvement in services.
The HWC facility validation tool is adapted from one of the standard facility assessment surveys- World Health Organization’s Service Availability and Readiness Assessment (SARA)[1]. The data obtained from the survey will be analysed to inform about the district level measure of the HWC service readiness and service availability.
The survey is planned to be conducted every year at these three sites.
Survey objectives:
- To determine district-level HWC facility service availability and readiness.
- To validate HWC facility performance indicators collected from routine data systems. The validation will enable district managers to identify areas for improving HWC data quality reported in routine data systems.
- To understand the baseline status before initiating any intervention.
Steps undertaken:
- Modified WHO’s SARA tool to Indian context and policy priorities: this was done through HWC program guideline reviews and consultations among IPSI partners. Tracer items were identified for: (i) general service readiness and (ii) service specific availability and readiness for the twelve service packages. A facility survey questionnaire was drafted.
- Pilot tested questionnaire, trained field investigators: the questionnaire was pilot tested at HWCs in Bhavnagar and Kalahandi; revisions were made based on operational feasibility and district context.
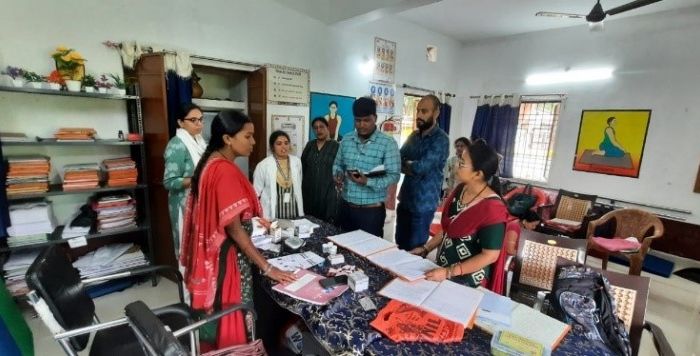
- Collected facility data: facility level data were collected through interviews with CHOs and facility observations at select HWCs in the two districts (Sept-Nov 2024). Data were entered into an Epicollect online tool.
- Analysed data: Data for tracer indicators were aggregated through unweighted means into domains and analysed as per the SARA guidelines to arrive at (1) general service readiness scores for CPHC and (2) specific service readiness scores for each service package, among sampled HWCs.
[1] World Health Organization. 2015. Service Availability and Readiness Assessment